2024 NBA Prospect Predictions
- seanemery517
- Oct 12, 2024
- 4 min read
Predicting the booms & busts of the worst draft class of recent memory.
Research Problem
As a die-hard blazers fan, my favorite part of the NBA season has come in June and July the past few years. A time where fans of the worst few teams in the league actually have a reason to get excited about their franchise and the future. A time where athletes (who I’ve started to refer to as kids now. God, I’m getting so old.) realize their lifelong dream of getting drafted to the pros. And, of course, a time for the blazers to make a decision that will come back to haunt them for years to come (ever heard of Michael Jordan or Kevin Durant?). I’m tired of my blazers being bad. I want to win soon, very soon. So, I wanted to see if I could use what I’ve been learning in school to save the blazers from their inevitable fate. I wanted to create a model that would predict how successful these draft prospects would be within the first few years of their careers’.
Methodology
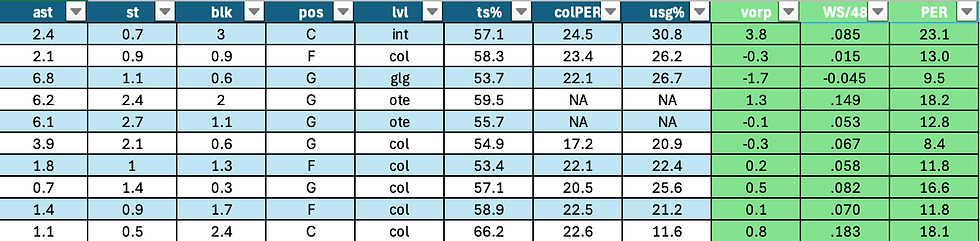
My favorite method for predictive analytics is regression analysis. So my plan was to use combine measurements and the previous year of college/international stats for everyone selected in the last 4 drafts as input data, and some of their NBA career advanced metrics (VORP, WS/48 & PER) as the response variable. The images below shows an example of the data collected for the 2023 draft class, with the highlighted columns being the output that I’m trying to predict for this years prospects.

Data Collection
It’s easy enough to mass export NBA data, but college & international data is a bit trickier to get a hold of. I downloaded as much data as I could from http://basketballreference.com and utilized data cleaning techniques in R & Excel, but I ended up having to fill in a lot of the gaps by hand.
Regression Model
Once the data had been cleaned, formatted, and standardized, I built my regression model in R. I made 4 models: 1 where the response variable was VORP, 1 where it was WS/48, 1 where it was PER, and 1 where I added up VORP, WS/48, & PER to create a makeshift catchall response variable. The last model with the sum of those advanced metrics as the response variable ended up being the best model, as you can see below. Even with a low adjusted R-Squared of 0.2648, it was better than the other models that were hovering around 0.17.
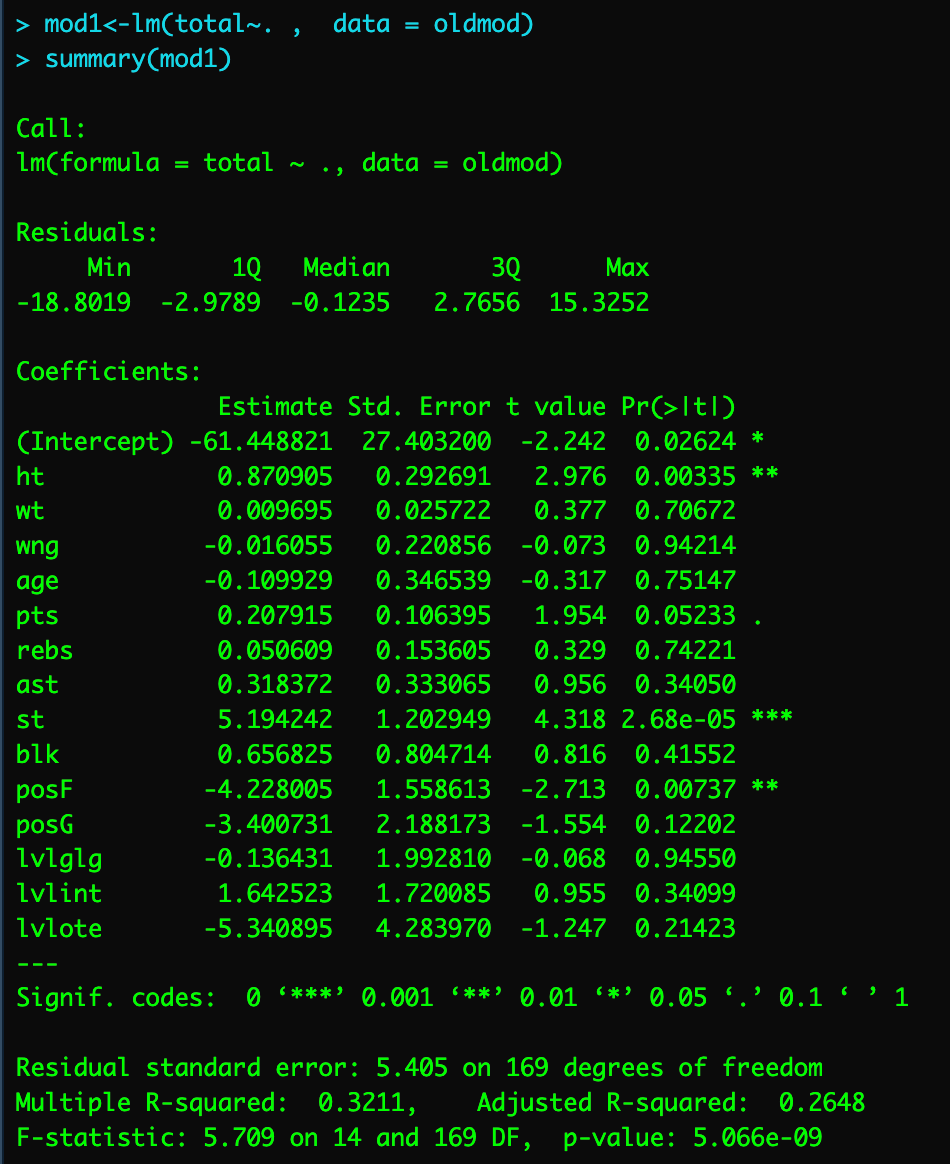
This model had plenty of mathematically insignificant variables, like wingspan, age, and what level they played at (college, g-league Ignite, international, or Overtime Elite). And the most significant predictors of early career success were height, steals, points, and what position you played. I implemented backward elimination, getting rid of the insignificant variables one at a time, until I got a slightly higher R-squared. But I still wasn’t happy with ~0.27. So I went back and added a few advanced stats from college/international play to see if that would help predict early career success. I also didn’t like how much the computer valued height. I added a nonlinear adjustment to height, so the model would account for the parabolic nature of height advantage in the NBA. Otherwise, the computer would assume someone who’s 8 feet tall would be the best player in the world, when we know that a player like that would struggle with the pace of the game. It helped a bit, getting our adjusted R-squared up to ~0.31.

As you can see, the final model still really values steals and height, but now also your PER in college (or international, g-league, etc.). Below is a scatter plot showing the actual vs predicted values for this model, and a line of best fit for reference.

Outcome
Unfortunately, the model still didn’t end up where I would’ve liked it. It still valued height a bit too much (thanks a lot Wemby), and therefore predicted the top 5 players in this draft to all be centers. But, on the other hand, it is true that taller players have a much easier time making an impact early on in their career than shorter players. It’s hard to learn the point guard position in the NBA. It’s hard to keep confidence in your 3-point shot as a rookie with a short leash. It’s easier to be a 7-foot 19-year-old and catch lobs, alter shots in the paint, and grab rebounds (yes I’m talking about you Derrick Lively). Below is the ordered list according to my model of the 58 prospects in The Ringer’s final mock draft. Again, this is by no means the most comprehensive or advanced model ever created, but I’m proud of it as a starting point. And who knows, maybe I’ll look back on this in 5 years and realize I’m a genius and the greatest basketball mind of my generation.
Picks 1-58 (according to the model)
Zach Edey
Donovan Clingan
Yves Missi
Alex Sarr
Kyle Filipowski
Jonathan Mogbo
Ron Holland
Kel’el Ware
Daron Holmes
Dillon Jones
Ulrich Chomche
Oso Ighodaro
Tyler Smith
Reed Sheppard
Jamal Shead
Tidjane Salaun
Juan Nunez
PJ Hall
Devin Carter
Adem Bona
Zach Risacher
Jaylon Tyson
KJ Simpson
Matas Buzelis
Terrence Shannon Jr
Tristan Da Silva
Tyler Kolek
Kevin McCullar Jr
Ajay Mitchell
Bobi Klintman
Ryan Dunn
Johnny Furphy
Isaiah Collier
Harrison Ingram
Jalen Bridges
Rob Dillingham
Baylor Scheierman
Cam Spencer
Nikola Djurisic
Dalton Knecht
Steph Castle
Pacome Dadiet
Tristen Newton
Ja’Kobe Walter
Keshad Johnson
Justin Edwards
Zyon Pullin
Jared McCain
Nikola Topic
Jaylen Wells
Kyshawn George
Melvin Ajinca
Cody Williams
Pelle Larsson
Carlton Carrington
Cam Christie
Trentyn Flowers
Bronny James


Comments